The Speeds That Shape Our Roads
by Tim Adams
When driving, the number on the speed limit sign may seem like the only speed ever considered for that road. But for transportation engineers, there are several different types of “speeds” that influence roadway design, operations, and safety outcomes. These speeds often overlap but can also conflict with one another. How they are defined and applied ultimately determines whether our roads encourage safe driving or foster an environment where speeds continually creep higher. We should start by defining these types of speeds:
Design Speed
The speed selected during the roadway’s design process. It helps determine curve radius, sight distance, lane widths, and other geometric elements. Traditionally, engineers have been encouraged to select a design speed at or above the anticipated posted speed to provide a “margin of safety.”Posted Speed
The legally enforceable number on roadside signs. This speed is supposed to reflect safe operation for most drivers under normal conditions. It is commonly set by the speed at which people are driving on the road.Operating Speed
The speed a driver actually travels in real-world conditions, regardless of the posted speed limit. This is typically measured through spot speed studies and is unique for each car, but generally is a bell-curve distribution.85th Percentile Speed
The speed at or below which 85% of drivers are traveling. This has historically been used as the primary basis for setting posted speed limits, under the assumption that most drivers choose a “reasonable and prudent” speed.
Other Types:
Statutory Speed
A default speed limit set by law (e.g., 25 mph in residential areas, 55 mph on highways) when no posted limit is present. These are set for all roads in a jurisdiction[1] and are based on the desired speed, rather than the speeds at which people are actually driving.[2]Advisory Speed
A recommended speed for specific conditions, such as curves, interchange ramps, or school zones, based on localized safety considerations. These are typically set after an engineering study evaluates a safe operating speed for the location.
A Speed Feedback Loop
For decades, engineers have often set posted speeds of an existing roadway using the 85th percentile speed of observed driver behavior. As stated earlier, the 85th percentile speed is a measurement of the speed that most drivers travel and is prudent for the roadway. Additionally, the 85th percentile speed is used to assess and potentially adjust the posted speed limit of an existing roadway.
Unlike design, posted, statutory, and advisory speeds, which engineers and legislators can dictate, the 85th percentile speed is measured to determine the actual speed after the roadway has been built and speed limit signs have been placed. By selecting a design speed above the intended speed limit, this can create a feedback loop:
The design speed of the roadway is set at 5-10 miles per hour over the intended speed limit (see Figure 1, an excerpt from the Nebraska Minimum Design Standards).
Drivers tend to travel at or faster than the posted speed (but rarely slower), and they feel comfortable driving this speed on the roadway.
A speed study is requested by locals who notice a lot of speeding, and the study finds a higher 85th percentile speed than what the posted speed limit shows.
The jurisdiction raises the posted limit.
Drivers go even faster.
Repeat the process a few years later until the posted speed approaches, or even exceeds, the original design speed.
This ratcheting effect can explain why some roadways today have speed limits above the original design speed intended. This leads to higher operating speeds, higher crash severity, and ultimately, more fatalities.
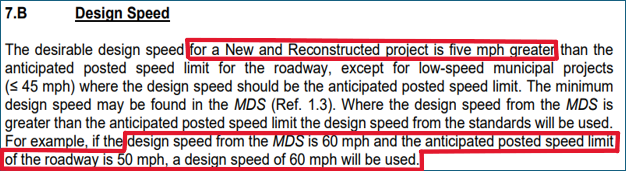
Figure 1 – Excerpt from the Nebraska Minimum Design Standards (Page 1-18), which dictates design standards for all State roads and many local roadways.
“Double Counting” Safety Factors
So why is it essential to keep speeds from creeping higher? We know that crashes at increasing speeds directly correlate with more severe crashes, as shown in Figure 2. However, we still need to travel to various places, so engineers must design roadways that maintain safety standards at specific speeds effectively. AASHTO’s (American Association of State Highway and Transportation Officials) Green Book, which sets design standards for most of the country’s roadways, defines design speed as the chosen speed that dictates roadway geometry and design equations.
These include the design equations for stopping sight distance, curve radius, and superelevation. All of these equations already have built-in safety margins. This includes: assumed driver reaction time is longer than the average; braking friction factors are lower than most vehicles can typically achieve; and conservative assumptions about perception, control, and pavement conditions.
In other words, a roadway designed for 30 mph already incorporates a factor of safety into its geometry. This is all good news and should not change. That being said, we do not need to set our design speeds above the intended speed limit. It allows and encourages drivers to drive at much higher speeds than planned.
When engineers design for a higher speed than the intended posted limit, for example, by designing to 40 mph when the posted speed limit is 30 mph, they are effectively double-counting safety factors. The result is counterproductive:
The geometry (wide lanes, flat curves, long distances, wider clear zones) communicates that 40 mph is safe.
Drivers often respond to geometry and operating speeds climb above the posted speed limit.
Future speed studies then document a higher 85th percentile, which is used to justify raising the posted speed.
What started as an attempt to “add safety” instead accelerates the speed creep problem. Because higher speeds correlate with an increased severity of crashes, safety can be lessened, leading to a higher frequency of crashes. Figure 2 shows the relationship between the speed of a vehicle and the risk of fatality for a belted driver in a head-on collision.
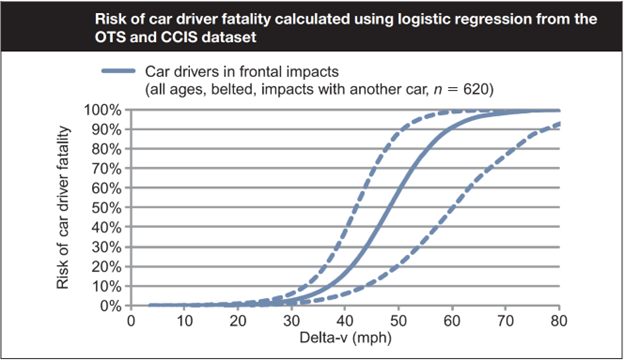
Figure 2 - Relationship between Speed and Risk of Fatal Injury (Figure 3.3) for a belted driver in a head-on collision.
The Argument: Aligning Posted and Design Speed
If not already aligned, jurisdictions should ensure that design speed and posted speed are the same:
Safety First: Because design calculations already include safety margins, setting design speed equal to posted speed ensures that the road is built to safely accommodate the intended operating conditions—without overdesign that encourages higher speeds.
Clarity and Consistency: Aligning the two speeds sends a clear message to drivers about what speed is safe. Mismatches create confusion and reduce compliance.
Preventing Upward Drift: If posted speeds are capped by design speed, repetitive speed studies won’t artificially inflate speed limits over time. Instead, roadway design will anchor operating behavior to safe, intended limits.
Safe System Alignment: Research consistently shows that higher speeds increase both crash frequency and crash severity. Aligning design and posted speeds supports safety goals by design, rather than relying too heavily on enforcement.
Our current approach to speed setting relies too heavily on measuring how fast people want to drive, rather than how fast they can safely drive. AASHTO’s Green Book and, therefore, Nebraska’s design standards already incorporate safety factors in the design process, so designing above the intended posted speed is not a cushion but can be a trap. Figure 3 illustrates a “Strong Towns” approach to speed studies, demonstrating how street design can be integrated into the process.
By aligning design speed and posted speed, we can ensure that roadway geometry, driver expectations, and safety outcomes are mutually reinforcing. In doing so, we shift from a reactive model, chasing the 85th percentile and increasing posted speed limits, to a proactive one where safety is dictated and designed into every mile of roadway.
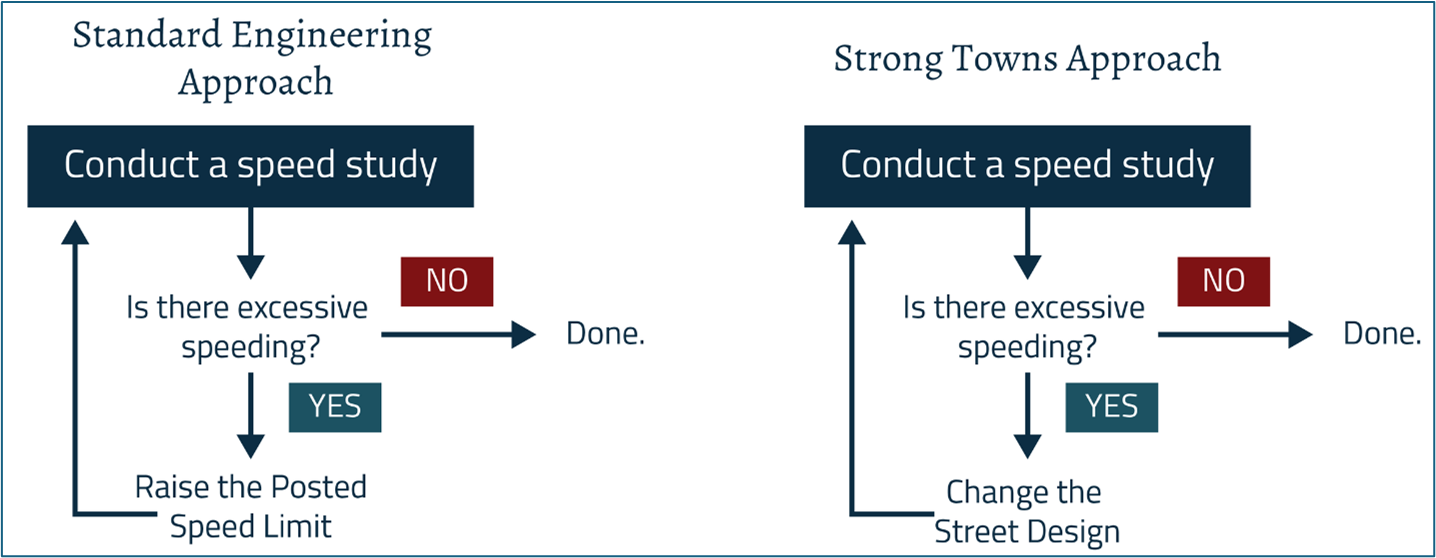
Figure 3 - Strong Towns (2018) diagram showing “Standard Engineering Approach” to speed studies versus a “Strong Towns Approach”.